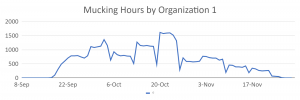
Volunteer Hours Fluctuation
Data Visualization supplements the thematic content analysis and allows both spatial and temporal analysis of volunteer data. Data related to spontaneous volunteers is collected during disaster response, but is not kept in a single repository nor is it always available as an open source. This research effort focused on the collection, cleaning, and analysis of aggregate spontaneous volunteer data. Data fields included volunteer hours, tasks types, service locations, length of stay, and volunteer origin. Outputs included the develop of visual representations of spontaneous volunteer response.

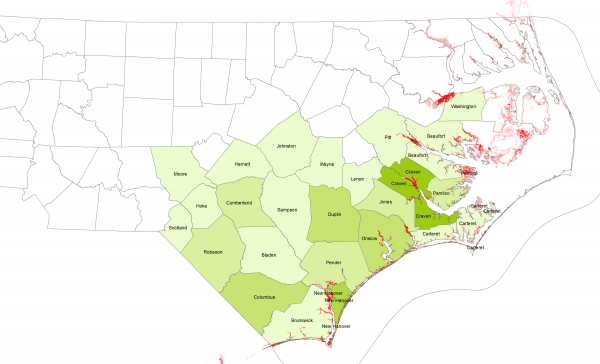
The visualizations below show the fluctuation of volunteers after Hurricane Florence in North Carolina from September, October, and November. We see that initially volunteers were more spread out throughout the east coast, before they consolidated their efforts in the eastern part of North Carolina, specifically around areas such as New Bern and Wilmington.